
Market Data · 2 min read
Q1-2022 Quarterly M&A Update
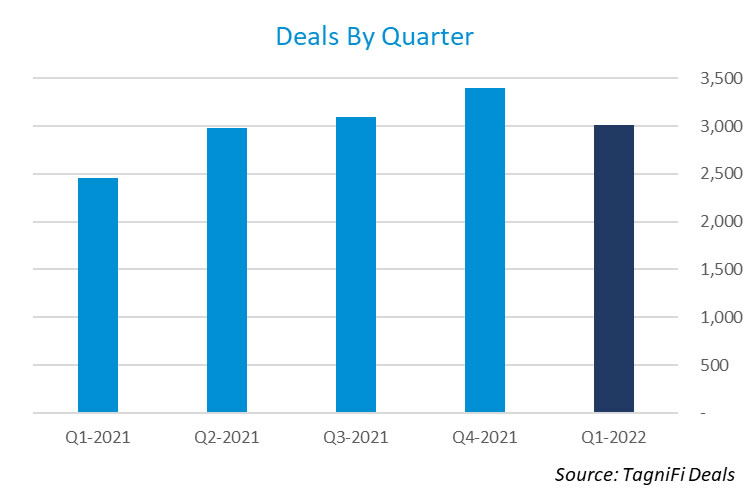
“U.S. M&A activity decreased noticeably in Q1 relative to Q4 yet remains well above the same quarter of 2021. There were 3,012 deals announced in Q1, a decrease of…
Highlights
“U.S. M&A activity decreased noticeably in Q1 relative to Q4 yet remains well above the same quarter of 2021. There were 3,012 deals announced in Q1, a decrease of 11% compared to Q4 yet still up 23% over the same quarter last year.”
Q4 Highlights
U.S. M&A activity decreased noticeably in Q1 relative to Q4 yet remains well above the same quarter of 2021. There were 3,012 deals announced in Q1, a decrease of 11% compared to Q4 yet still up 23% over the same quarter last year.
- ·There were 3,012 M&A deals announced in Q1.
- ·The total disclosed transaction value was $442 billion, down 19% from the $545 billion of deal value disclosed in Q4.
- ·California led the nation with 382 announced deals.
- ·The most popular deal type was the 100% Buyout which represented 41% of the announced deals.
- ·Private companies were the most popular acquirer type with 55% of the deals announced, up from 47% last quarter.
- ·The most active sector was Services with 63% of the deals announced, up from 60% last quarter.
- ·Integrity Marketing Group, LLC was the most acquisitive strategic buyer with 19 deals announced.
- ·Insight Partners was the most active financial buyer with 21 deals announced.
- ·Goldman Sachs was the most active financial advisor with 37 deals announced.
- ·Kirkland & Ellis LLP was the most active legal advisor with 86 deals announced.