
Q2-2022 Quarterly M&A Update
“U.S. M&A activity decreased noticeably in Q1 relative to Q4 yet remains well above the same quarter of 2021. There were 3,012 deals announced in Q1, a decrease of…
Highlights
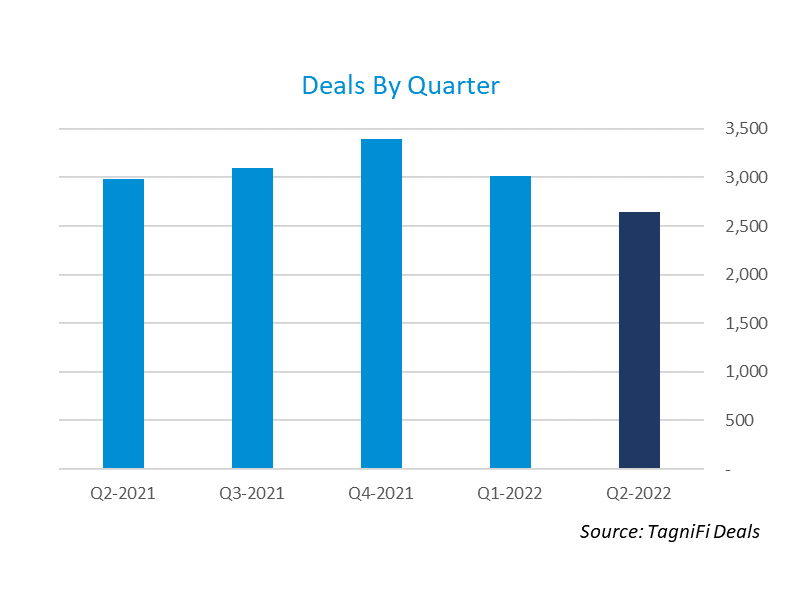
“U.S. M&A activity decreased noticeably in Q1 relative to Q4 yet remains well above the same quarter of 2021. There were 3,012 deals announced in Q1, a decrease of 11% compared to Q4 yet still up 23% over the same quarter last year.”
Q2 Highlights
U.S. M&A activity continued its decline in Q2 due to increased borrowing costs and reduced valuation multiples, ending the quarter down 12% from Q1 as well as compared to the same quarter last year. There were 2,639 deals announced in Q2, a decrease of 22% compared to the record number of deals reported in Q4 when 3,400 deals were announced.
- ·There were 2,639 M&A deals announced in Q2.
- ·The total disclosed transaction value was $451 billion, up 2% from the $442 billion of deal value disclosed in Q1.
- ·California led the nation with 381 announced deals.
- ·The most popular deal type was the 100% Buyout which represented 40% of the announced deals.
- ·Private companies were the most popular acquirer type with 56% of the deals announced, up from 55% last quarter.
- ·The most active sector was Services with 61% of the deals announced, down from 63% last quarter.
- ·Arthur J. Gallagher & Co. was the most acquisitive public strategic buyer with 9 deals announced.
- ·HUB International Ltd. was the most acquisitive private strategic buyer with 14 deals announced.
- ·Advent International was the most active financial buyer with 7 deals announced.
- ·Goldman Sachs was the most active financial advisor with 31 deals announced.
- ·Kirkland & Ellis LLP was the most active legal advisor with 87 deals announced.
Reproduce this
Every figure here comes from TagniFi. Open the same filters and pull the exhibit yourself.
Get this quarterly
One email when the transaction review posts. No product marketing.